The problem
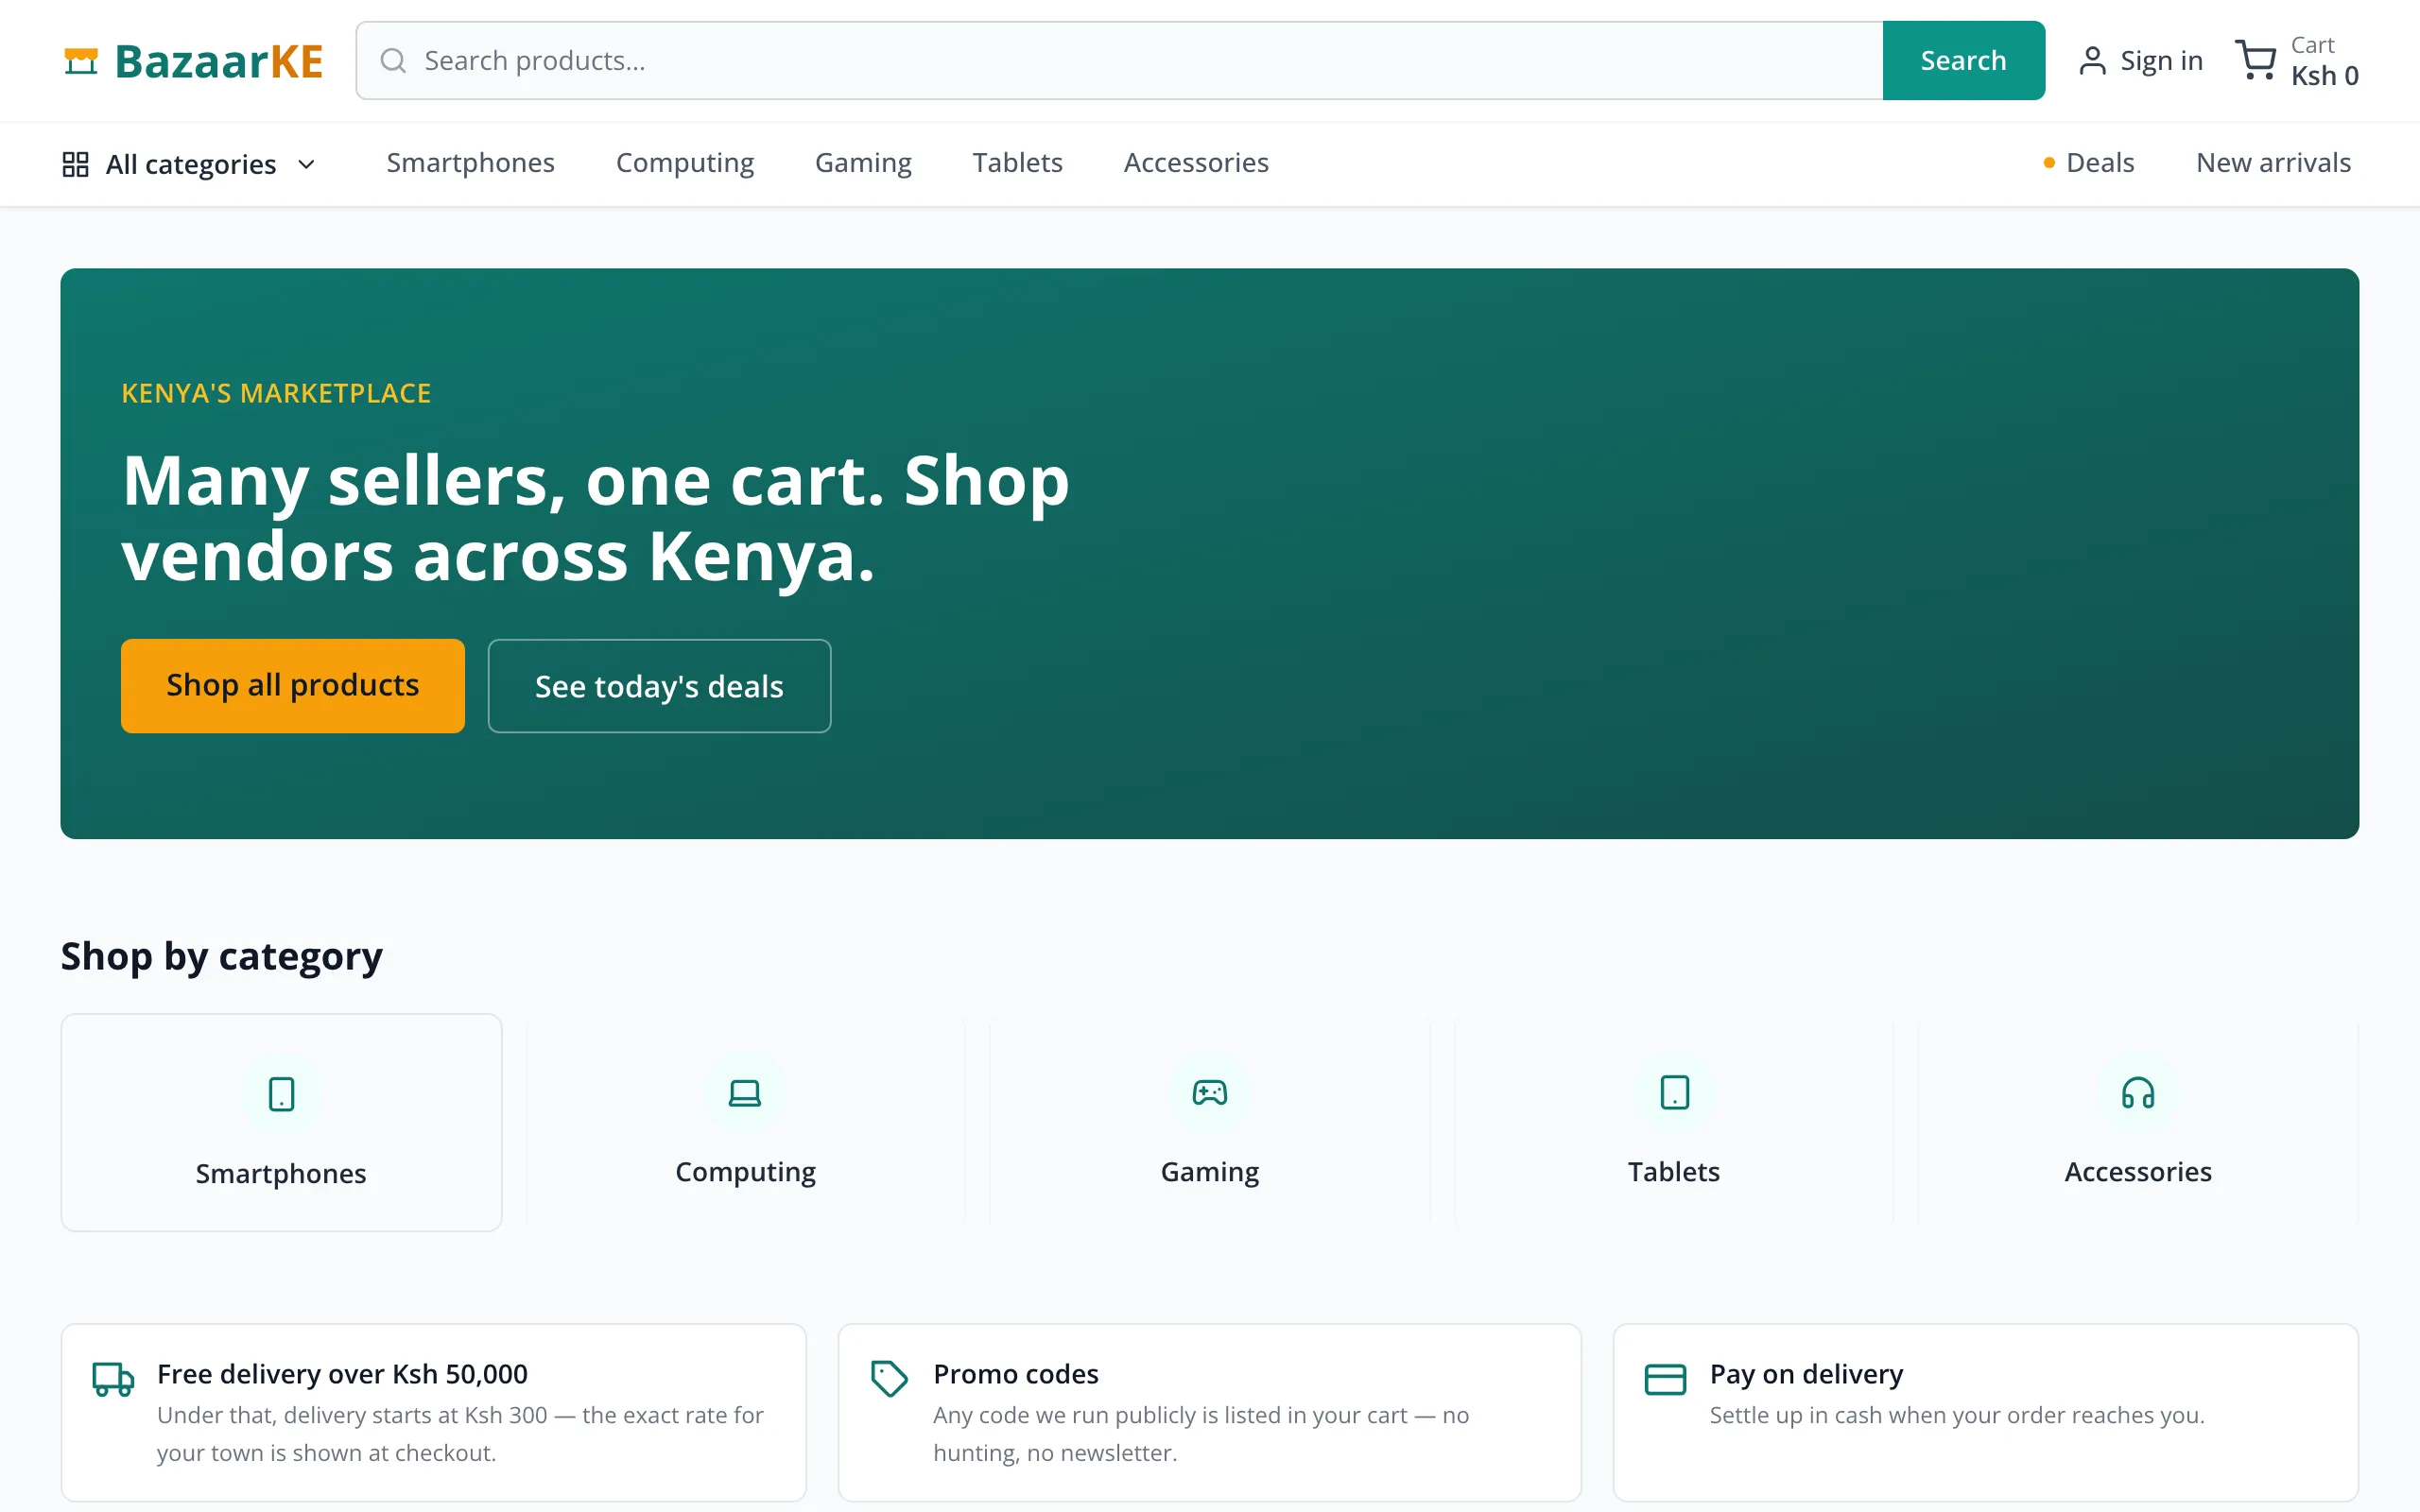
A multi-vendor marketplace is two products sharing one codebase: a storefront for shoppers and a control room for the vendors selling through it. Both run on the same orders, the same stock and the same money, and neither side may see or change what belongs to the other.
Decisions
Money is computed server-side, always
newOrder rebuilds every line item from the database (name, unit price, vendor) and takes only a product id and a quantity from the request, then derives subtotal, discount, shipping and total itself. It used to accept price, subtotal and total from the body, which meant a hand-rolled POST could buy the catalogue for a shilling. Checkout now sends items, a coupon code and an address, and nothing that prices them.
The payment word and the fulfilment word never collide
Every order surface shows both states at once, and the two enums started out sharing vocabulary: a cash-on-delivery order read “pending” in the status column and again under the total, for two unrelated reasons. One module owns the payment wording and deliberately uses no word that appears in the order-status enum: Unpaid, Paid, Payment failed, Money refunded, Partly refunded.
The dashboard is a separate bundle
The vendor and admin area pulls in Radix and a data table, and a shopper should never download it. Route-level code splitting puts initial JS at roughly 330KB, against 1.2MB unsplit.
The hard part
Analytics that refuses to invent numbers
The obvious way to report revenue is to count paid orders. That is wrong here: cash on delivery stays pending for its entire life, so filtering on payment status would hide most of the shop’s actual sales. Revenue counts orders that were not cancelled or refunded, priced at the moment they were placed, and a separate figure answers the unpaid question on its own.
The same care applies to the parts that look like presentation. Buckets are pinned to Africa/Nairobi so a 9pm sale does not land on the next day’s bar, and the range switches from daily to monthly past 92 days. Percentage change returns null when there is nothing to compare against, such as an all-time range or a previous period of zero, and the UI renders nothing at all for null, because a “+100%” against an empty period looks like data and isn’t. There is no traffic or conversion section, because nothing in the app records a page view and a funnel with no events behind it is a decoration.
The charts are hand-rolled SVG with a text summary for screen readers. Recharts alone would have added about 100KB to a bundle that was split to keep it out of a shopper’s download.